What is Hypothesis Testing?
Hypothesis testing is at the core of statistical analysis as it allows us to make assumptions about our samples. These assumptions are formulated into null and alternate hypotheses. A null hypothesis is an assumption that there is no effect present in a dataset. The null hypothesis explains differences in measures as random chance or measurement error. Conversely, an alternate hypothesis states that differences in measured data are caused by effect of some kind. For example, assume that you are studying the effect of sunlight on plant growth. A null hypothesis would state that plants who get different amounts of light will have the same levels of growth, but the alternative hypothesis states that plants with different amounts of light will have different amounts of growth. The aim in hypothesis testing is to show that variance in data is not the result of random noise, thereby rejecting the null hypothesis and accepting the alternate hypothesis. To accomplish this task, a test statistic is calculated and converted into a p-value, which is the propability that the null hypothesis is correct. This p-value is then compared to a significance level which is chosen to represent how confident a reasearcher can be that the results of a test are not due to chance. Significance levels can change based on whether a test is one-tailed or two-tailed. A one-tailed test is looking for an effect in one direction, while a two-tailed test does not care about a direction, but is instead looking for any difference. In the example of plant growth, a one tailed test would state as an alternate hypothesis that plants that recieve more light will have more growth, where a two-tailed test would state that plants with different levels of light have different levels of growth (i.e. it doesnt matter if there is more or less growth with more light). A typical significance level is set to .05, which means that there is only a 5% chance that the null hypothesis could explain the effect present in the data. For a one-tailed test, you would need a p-value lower than .05 to reject the null hypothesis, but for a two-tailed test you would need a p-value lower than .025. This difference is do to the fact that a two tailed test splits the .05 critical value since the effect can be in either direction. If you are able to reject the null hypothesis than you can determine the effect size, which will give you an idea of how strong the effect is. If you would like to know more about hypothesis testing, this article provides an excellent breakdown in more detail.
How do I Determine a Test Statistic?
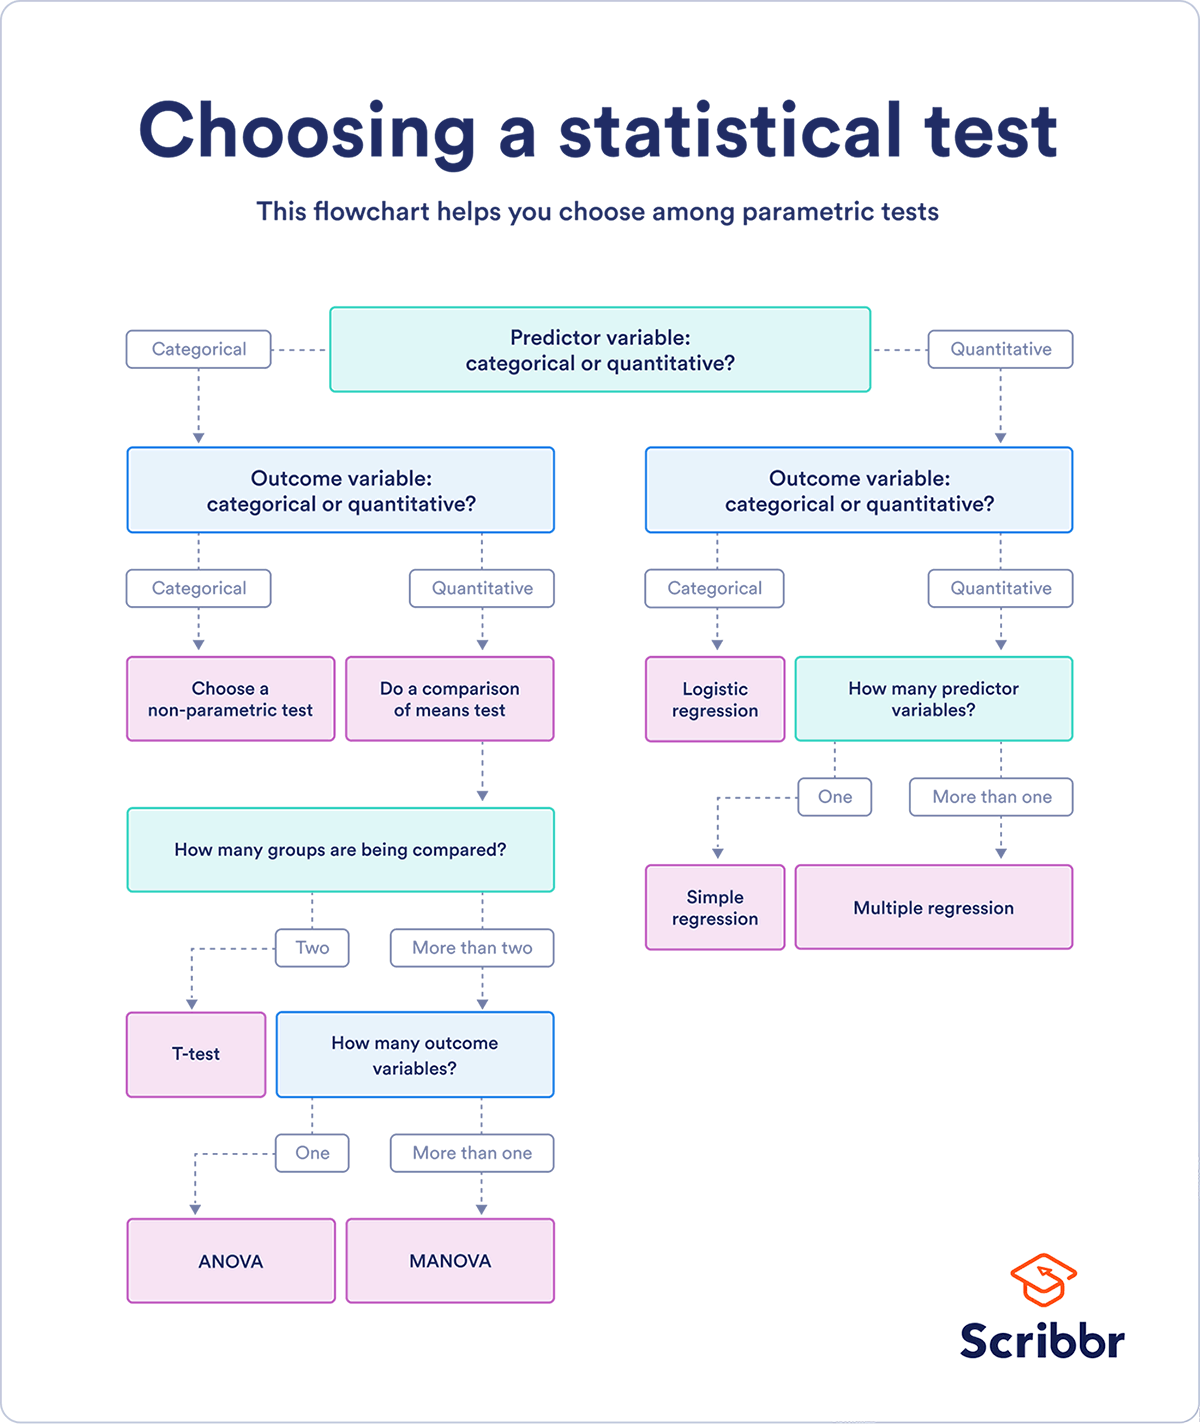
One of the most confusing parts of running a hypothesis test is deciding which statistic to calculate. There are many different types of statistical tests depending on the type of information present in your dataset, and each calculates a statistic in a different way. The best way to decide how to calculate a statistic is to take a good look at your data. First, is your predictor variable categorical or quantitative? Data is quantitative when it measures an amount and is represented by integers or proportions. Categorical data on the other hand measures groupings. It is represented by binary data, ordered groupings, or names of categories. Next you will need to ask what kind of data is your outcome variable. The answers to these two questions will generally tell you which kind of statistic you will be calculating. From there, you may need to answer a few more questions to determine which type of test you will run to determine that statistic. Here is a handy flowchart from Scribbr to determine which test is best for your data:
Let’s go over two common types of tests using examples from one of my recent projects. The project, found here, used the Northwind Database to collect and test information. I had access to different types of data, and consequently used a few different types of hypothesis tests.
Welch’s T-Test
One test that I used was Welch’s T-Test, which is a type of independant t-test. This test measures two samples and uses categorical predictor variables and quantatative outcome variables. In the project, I was looking at the differences in quantities of products that were sold based on whether or not their prices were discounted. The null hypothesis was that there would be no difference in sales between the two groups, while the alternative hypothesis stated that discounted orders would contain more items sold (one-tailed test). To determine a test statistic (in this case a t-statistic), you subtract the mean of one group from the mean of the second group. Then, divide the result by the square root of the sum of the variance of each group divided by the sample size of that group. That is a lot to take in, but is easily summed up by this formula:
t’ = (m1-m2) / √(s1/n1 + s2/n2)
Thankfully, python’s scipy module makes this a bit easier, just set your samples as experimental and control, run the test, and collect the p-value like this:
results = stats.ttest_ind(experimental, control, equal_var=False)
p = results[1]
From there, you can simply compare your p-value with your chosen signficance level. In my case, p < .05, so I was able to reject the null hypothesis. Welch’s T-test is a handy way to compare two samples fairly easily, but it is not useful for every situation. Let’s look at another type of hypothesis test.
ANOVA
In the above example of looking at discounted products, suppose you wanted examine if there was a difference in quantities sold based on the level of discount (5%, 10%, etc). A t-test would not be appropriate here because there are more than two levels of discounts. You would need to run an analysis of variance (ANOVA) test. This test also uses categorical predictors and quantitative outcome variables; however, ANOVA allows for testing the means of more than two samples. Instead of a t-statistic, an ANOVA test calculates an F-statistic. Here is the general formula of an ANOVA,

where MST is the mean square between groups and MSE stands for the mean square due to errors. In this formula, k is the number of groups, T is the sum of one group i, ni is the sample size of i, G is the sum of all values, n is the entire sample size and Yij is an observation. This involves a lot of math by hand, but thankfully we can very quickly compute this using statsmodels:
import statsmodels.api as sm
from statsmodels.formula.api import ols

formula = 'Quantity ~ C(Discount)'
lm = ols(formula, df).fit()
table = sm.stats.anova_lm(lm, typ=2)
table
In this example, Quantity is our outcome variable, Discount is our predictor, and df is a dataframe of our data. The C is showing that Discount is a categorical variable. This code will print out a table that contains the MST, MSE, degrees of freedom, F-statistic and p-value. Once again, just check if your p-value is less than .05 (ANOVAs are always one-talied) and if so you can reject the null hypothesis. In my project, I was unable to reject the null hypothesis, and thus did not observe a significant effect of discount level on quantity of items sold.
Summary
Hypothesis testing is incredibly important to statistical analysis as it gives the analysis meaning. In this post we have explored the general goals and method of hypothesis testing and examined two of the more common types of hypothesis tests. There are obviously many more types of test you can run, and many other aspects to hypothesis testing, so if you are interested in further exploring these topics then I would encourage you to check out the links below. Thanks for taking the time to read this post, and happy coding!
Further Reading
More on hypothesis testing: https://statisticsbyjim.com/hypothesis-testing/statistical-hypothesis-testing-overview/)
A good overview of different types of hypothesis tests: https://www.scribbr.com/statistics/statistical-tests/
More on Welch’s T-Test: https://www.statisticshowto.com/welchs-test-for-unequal-variances/
More on ANOVA: https://www.statsdirect.com/help/analysis_of_variance/one_way.htm